Diagnostic Medical Sonographer Salary in Wisconsin: $108,505 (2026)
Quick Answer:Across Wisconsin's 46 metropolitan areas, the average median diagnostic medical sonographer pay sits at $108,505/year heading into 2026 — a figure projected from 2025 BLS OEWS wage data for SOC 29-2032. Because Wisconsin sits at BEA RPP 93.4 (7% below the U.S. baseline), that statewide median translates to roughly $116,172 in nationally-comparable purchasing power. Highest-paying metros: Racine ($109,910), Mount Pleasant ($109,747), Waukesha ($106,819).
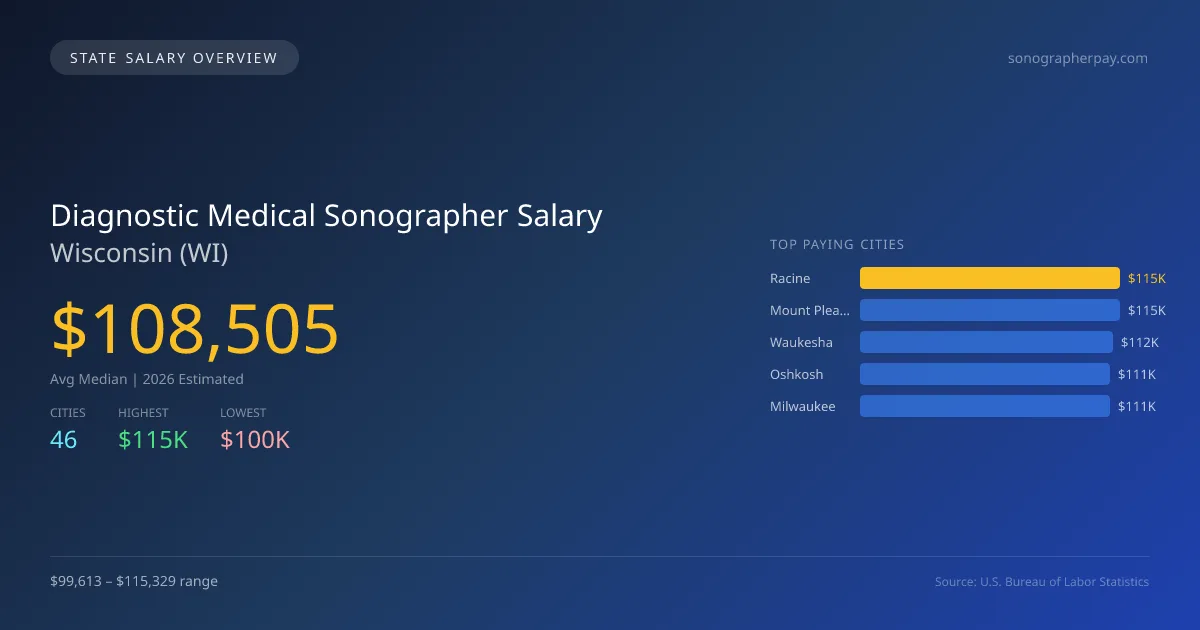
The projected average median salary for diagnostic medical sonographers in Wisconsin for 2026 is $108,505, which is notably higher than the national median of $101,352, representing a 7.1% premium. The salary differences among cities in Wisconsin are significant, with Racine at the top earning $115,329, while Wisconsin Rapids has the lowest at $99,613. This $15,716 gap is influenced by factors such as local demand for healthcare services, cost of living, and the presence of healthcare facilities. In Wisconsin, diagnostic medical sonographers must adhere to state licensing requirements and scope of practice laws that may vary from other states, directly impacting employment opportunities. The projected annual compound growth rate for this profession in the state is 4.93%, aligning with an increasing demand for medical imaging services, as healthcare facilities continue to expand and technology evolves. With a total of 1,363 employed diagnostic medical sonographers, the job market in Wisconsin shows promise. Cities like Mount Pleasant, Waukesha, Oshkosh, and Milwaukee also offer competitive salaries ranging between $110,691 and $115,158, indicating that various regions within the state are seeking skilled professionals in this field.
Wisconsin Diagnostic Medical Sonographer Salary Range
Overall salary range in Wisconsin: $72,088 (lowest entry-level) to $144,884 (highest top earner)
Wisconsin vs National Average
Wisconsin diagnostic medical sonographers earn 7.06% more than the national median (+$7,153/year difference).
Wisconsin Diagnostic Medical Sonographer Salary Distribution (2026)
Diagnostic Medical Sonographer salaries in Wisconsin range from $87,832 (entry-level, 10th percentile) to $131,835 (top earners, 90th percentile), with a median of $108,505. The Wisconsin median is $7,153 above the US national median of $101,352. The average hourly rate is $52.17/hr. Approximately 1,363 diagnostic medical sonographers are employed across 46 cities.
2019 BLS Actual
$86,578
2025 BLS Actual
$103,407
2026 Current Est.
$108,505
2019–2027 Growth
+31.5%
Salary Trajectory for Diagnostic Medical Sonographers in Wisconsin (2019–2027)
2019–2025: actual BLS OEWS data for this metro area. 2026+: CAGR 4.93% projection.
| Year | Annual Salary | Status |
|---|---|---|
| 2019 | $86,578 | Actual |
| 2020 | $88,296 | Actual |
| 2021 | $92,741 | Actual |
| 2022 | $96,393 | Actual |
| 2023 | $100,568 | Actual |
| 2024 | $95,509 | Actual |
| 2025 | $103,407 | Actual |
| 2026(current) | $108,505 | Estimated |
| 2027 | $113,854 | Projected |
Based on 7 years of BLS OEWS data for the Wisconsin metropolitan area, the median diagnostic medical sonographer salary grew 19.4% from $86,578 (2019) to $103,407 (2025). At a 4.93% compound annual growth rate, salaries are projected to reach $113,854 by 2027 — a total increase of $27,276 (31.50%) from 2019.
Note: Historical values (2019–2025) are actual BLS OEWS figures for the Wisconsin metropolitan area, sourced from annual Occupational Employment and Wage Statistics surveys. 2026–2026 figures are current estimates, and 2027 values are projections, calculated using a 4.93% CAGR derived from 7-year BLS historical data. Actual salaries may vary based on employer, experience, certifications, and local market conditions.
Top 5 Highest Paying Cities in Wisconsin
Lowest Paying Cities in Wisconsin
| City | Median Salary |
|---|---|
| Wisconsin Rapids | $99,613 |
| Middleton | $100,447 |
| Platteville | $101,525 |
| Mequon | $101,533 |
| River Falls | $102,375 |
Best Value Cities for Diagnostic Medical Sonographers in Wisconsin
When adjusted for local cost of living, these Wisconsin cities offer the most purchasing power for diagnostic medical sonographers.
| City | Nominal Salary | CoL Index | Adjusted Salary |
|---|---|---|---|
| Mount Pleasant | $115,158 | 93.4 | $123,296 |
| Racine | $115,329 | 95.961 | $120,183 |
| Waukesha | $112,085 | 93.4 | $120,005 |
| Oshkosh | $110,743 | 92.929 | $119,169 |
| Eau Claire | $109,739 | 93.4 | $117,494 |
Adjusted salary = nominal salary × (100 / CoL index). CoL index: 100 = national average. Lower index = lower cost of living.
Salary by Experience Level in Wisconsin
| Experience Level | Estimated Annual |
|---|---|
| Entry Level (0-2 years) | $87,832 |
| Mid Career (3-7 years) | $108,505 |
| Experienced (7+ years) | $131,835 |
Estimates based on BLS percentile data averaged across Wisconsin metro areas. Individual pay varies by employer, certifications, and specialization.
All 46 Cities in Wisconsin
| # | City | Median Salary |
|---|---|---|
| 1 | Racine | $115,329 |
| 2 | Mount Pleasant | $115,158 |
| 3 | Waukesha | $112,085 |
| 4 | Oshkosh | $110,743 |
| 5 | Milwaukee | $110,691 |
| 6 | Eau Claire | $109,739 |
| 7 | Sheboygan | $108,791 |
| 8 | West Allis | $108,733 |
| 9 | Kenosha | $108,645 |
| 10 | Fitchburg | $108,012 |
| 11 | Greenfield | $108,003 |
| 12 | Green Bay | $107,585 |
| 13 | Menomonee Falls | $107,067 |
| 14 | Madison | $106,987 |
| 15 | Brookfield | $106,815 |
| 16 | West Bend | $106,755 |
| 17 | Appleton | $106,714 |
| 18 | De Pere | $106,671 |
| 19 | New Berlin | $106,468 |
| 20 | Wausau | $105,634 |
| 21 | Sun Prairie | $105,567 |
| 22 | Caledonia | $105,279 |
| 23 | Muskego | $105,052 |
| 24 | La Crosse | $105,015 |
| 25 | Beloit | $104,991 |
| 26 | Janesville | $104,752 |
| 27 | Stevens Point | $104,563 |
| 28 | Franklin | $104,445 |
| 29 | Oak Creek | $104,117 |
| 30 | Superior | $103,956 |
| 31 | Manitowoc | $103,906 |
| 32 | Fond du Lac | $103,585 |
| 33 | Pewaukee | $103,519 |
| 34 | Onalaska | $103,495 |
| 35 | South Milwaukee | $103,216 |
| 36 | Pleasant Prairie | $103,200 |
| 37 | Menomonie | $103,094 |
| 38 | Whitewater | $103,085 |
| 39 | Wauwatosa | $102,995 |
| 40 | Germantown | $102,923 |
| 41 | Marshfield | $102,882 |
| 42 | River Falls | $102,375 |
| 43 | Mequon | $101,533 |
| 44 | Platteville | $101,525 |
| 45 | Middleton | $100,447 |
| 46 | Wisconsin Rapids | $99,613 |
More Wisconsin Salary Data
Hourly Rates
Explore diagnostic medical sonographer hourly pay in Wisconsin cities.
Entry Level
Starting salaries for new diagnostic medical sonographers.
Senior / Experienced
Top earner salaries for experienced diagnostic medical sonographers.
Explore More Diagnostic Medical Sonographer Salary Data
Frequently Asked Questions
How much do diagnostic medical sonographers make in Wisconsin in 2026?
What is the highest paying city for diagnostic medical sonographers in Wisconsin?
How does Wisconsin diagnostic medical sonographer pay compare to the national average?
What is the entry-level diagnostic medical sonographer salary in Wisconsin?
How many diagnostic medical sonographers are employed in Wisconsin?
Which Wisconsin city offers the best value for diagnostic medical sonographers?
Written by Aisha Khan, RDMS, RVT
Career Analyst
Aisha has over 10 years of experience in abdominal sonography. She works at a regional hospital. Aisha also conducts training for new sonographers.
Methodology & Data Source
Statewide salary figures on this page are 2026 projections based on the Bureau of Labor Statistics Occupational Employment and Wage Statistics (OEWS) survey, May 2026 release. A 4.93% compound annual growth rate (CAGR), derived from 6-year national BLS wage trends, was applied to each metro area's reported salary to estimate current 2026 diagnostic medical sonographer compensation across Wisconsin. State averages are employment-weighted across 46 metro areas — larger metro areas with more diagnostic medical sonographerscontribute proportionally more to the average, producing figures that better reflect typical compensation. Individual pay varies by city, employer, certifications, and experience.
Data Sources & Methodology
Source: BLS, OEWS, 7-year dataset (–). Per-city data from annual BLS metropolitan area surveys.
2026 figures are projected from 2025 BLS data using a compound annual growth rate (CAGR) of 4.93%, derived from historical BLS wage trends for diagnostic medical sonographers (SOC 29-2032).
Compiled and verified by Aisha Khan, RDMS, RVT, a licensed diagnostic medical sonographer with 10+ years of clinical experience. · View source data at BLS.gov