Diagnostic Medical Sonographer Salary in Washington: $125,479 (2026)
Quick Answer:Across Washington's 50 metropolitan areas, the average median diagnostic medical sonographer pay sits at $125,479/year heading into 2026 — a figure projected from 2025 BLS OEWS wage data for SOC 29-2032. Because Washington sits at BEA RPP 107.4 (7% above the U.S. baseline), that statewide median translates to roughly $116,833 in nationally-comparable purchasing power. Highest-paying metros: Bellevue ($131,234), Seattle ($129,960), Vancouver ($129,247).
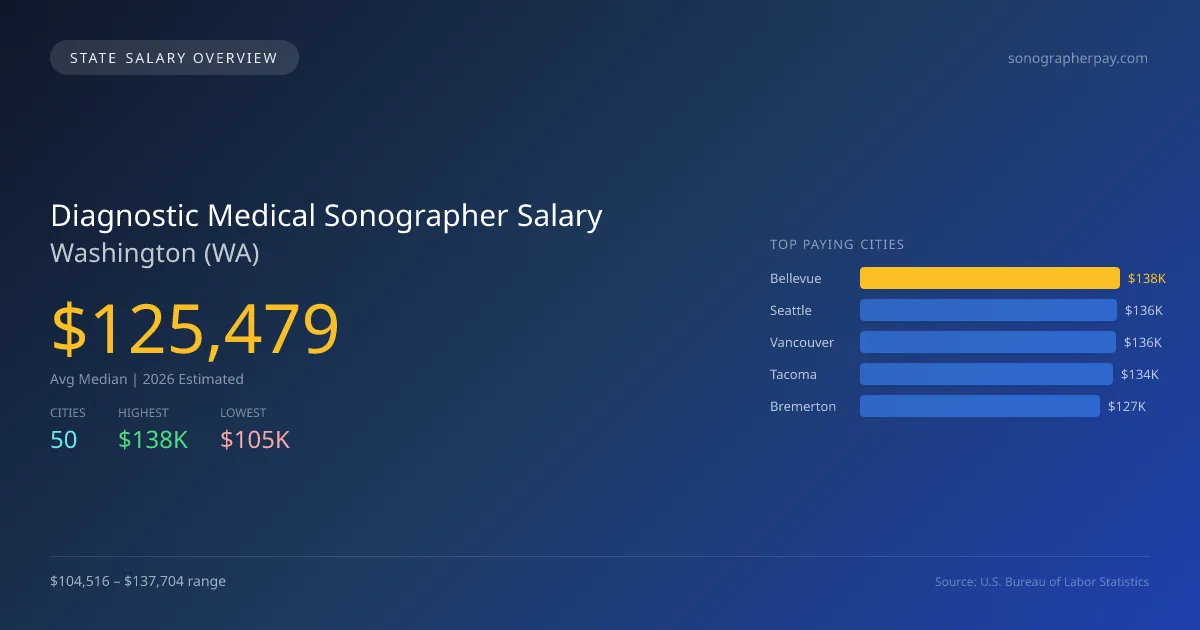
In 2026, the average median salary for diagnostic medical sonographers in Washington is projected to be $125,478, significantly surpassing the national median of $101,352 by 23.8%. The highest-paying city in the state is Bellevue, with a salary of $137,704, while Tukwila offers the lowest at $104,516. This salary gap of $33,188 between Bellevue and Tukwila can be attributed to factors such as the cost of living in different areas, demand for healthcare services, and the concentration of advanced medical facilities. Washington has specific state licensing requirements and scope of practice laws that are conducive to the profession. These regulations help maintain high standards and reflect the demand for qualified sonographers, driven by a growing healthcare sector. The job market is expected to expand with a projected annual growth rate of 4.93%, indicative of consistent demand for diagnostic imaging services. Major cities like Seattle, Vancouver, Tacoma, and Bremerton also offer competitive salaries, ranging from $134,092 in Tacoma to $135,619 in Vancouver, confirming the state's strong position in this field. With a total employment of 2,406 sonographers in Washington, there are ample opportunities for those entering the profession or seeking advancement.
Washington Diagnostic Medical Sonographer Salary Range
Overall salary range in Washington: $49,359 (lowest entry-level) to $194,632 (highest top earner)
Washington vs National Average
Washington diagnostic medical sonographers earn 23.81% more than the national median (+$24,127/year difference).
Washington Diagnostic Medical Sonographer Salary Distribution (2026)
Diagnostic Medical Sonographer salaries in Washington range from $70,758 (entry-level, 10th percentile) to $158,649 (top earners, 90th percentile), with a median of $125,479. The Washington median is $24,127 above the US national median of $101,352. The average hourly rate is $60.33/hr. Approximately 2,406 diagnostic medical sonographers are employed across 50 cities.
2019 BLS Actual
$91,965
2025 BLS Actual
$119,583
2026 Current Est.
$125,479
2019–2027 Growth
+43.2%
Salary Trajectory for Diagnostic Medical Sonographers in Washington (2019–2027)
2019–2025: actual BLS OEWS data for this metro area. 2026+: CAGR 4.93% projection.
| Year | Annual Salary | Status |
|---|---|---|
| 2019 | $91,965 | Actual |
| 2020 | $94,624 | Actual |
| 2021 | $95,746 | Actual |
| 2022 | $103,098 | Actual |
| 2023 | $100,657 | Actual |
| 2024 | $113,340 | Actual |
| 2025 | $119,583 | Actual |
| 2026(current) | $125,479 | Estimated |
| 2027 | $131,665 | Projected |
Based on 7 years of BLS OEWS data for the Washington metropolitan area, the median diagnostic medical sonographer salary grew 30.0% from $91,965 (2019) to $119,583 (2025). At a 4.93% compound annual growth rate, salaries are projected to reach $131,665 by 2027 — a total increase of $39,700 (43.17%) from 2019.
Note: Historical values (2019–2025) are actual BLS OEWS figures for the Washington metropolitan area, sourced from annual Occupational Employment and Wage Statistics surveys. 2026–2026 figures are current estimates, and 2027 values are projections, calculated using a 4.93% CAGR derived from 7-year BLS historical data. Actual salaries may vary based on employer, experience, certifications, and local market conditions.
Top 5 Highest Paying Cities in Washington
Lowest Paying Cities in Washington
| City | Median Salary |
|---|---|
| Tukwila | $104,516 |
| Mountlake Terrace | $104,677 |
| Covington | $106,148 |
| Kenmore | $106,157 |
| Oak Harbor | $106,845 |
Best Value Cities for Diagnostic Medical Sonographers in Washington
When adjusted for local cost of living, these Washington cities offer the most purchasing power for diagnostic medical sonographers.
| City | Nominal Salary | CoL Index | Adjusted Salary |
|---|---|---|---|
| Bellevue | $137,704 | 107.4 | $128,216 |
| Vancouver | $135,619 | 107.4 | $126,275 |
| Tacoma | $134,092 | 107.4 | $124,853 |
| Seattle | $136,367 | 111.133 | $122,706 |
| Bremerton | $127,322 | 105.607 | $120,562 |
Adjusted salary = nominal salary × (100 / CoL index). CoL index: 100 = national average. Lower index = lower cost of living.
Salary by Experience Level in Washington
| Experience Level | Estimated Annual |
|---|---|
| Entry Level (0-2 years) | $70,758 |
| Mid Career (3-7 years) | $125,479 |
| Experienced (7+ years) | $158,649 |
Estimates based on BLS percentile data averaged across Washington metro areas. Individual pay varies by employer, certifications, and specialization.
All 50 Cities in Washington
| # | City | Median Salary |
|---|---|---|
| 1 | Bellevue | $137,704 |
| 2 | Seattle | $136,367 |
| 3 | Vancouver | $135,619 |
| 4 | Tacoma | $134,092 |
| 5 | Bremerton | $127,322 |
| 6 | Tumwater | $117,857 |
| 7 | Olympia | $116,787 |
| 8 | Renton | $116,026 |
| 9 | Lacey | $115,829 |
| 10 | Bellingham | $115,675 |
| 11 | Everett | $114,903 |
| 12 | Marysville | $114,042 |
| 13 | Shoreline | $113,415 |
| 14 | Wenatchee | $113,073 |
| 15 | Redmond | $112,968 |
| 16 | Kent | $112,874 |
| 17 | Kirkland | $112,690 |
| 18 | Mount Vernon | $112,632 |
| 19 | Yakima | $112,590 |
| 20 | Burien | $112,546 |
| 21 | Spokane Valley | $112,543 |
| 22 | Federal Way | $112,052 |
| 23 | Des Moines | $112,027 |
| 24 | Auburn | $111,767 |
| 25 | Lakewood | $111,722 |
| 26 | Issaquah | $111,659 |
| 27 | Richland | $111,391 |
| 28 | Sammamish | $110,926 |
| 29 | University Place | $110,887 |
| 30 | SeaTac | $110,799 |
| 31 | Spokane | $110,418 |
| 32 | Pasco | $110,326 |
| 33 | Longview | $110,273 |
| 34 | Edmonds | $109,650 |
| 35 | Lake Stevens | $109,360 |
| 36 | Lynnwood | $109,290 |
| 37 | Kennewick | $109,117 |
| 38 | Moses Lake | $109,079 |
| 39 | Bothell | $109,000 |
| 40 | Pullman | $108,518 |
| 41 | Puyallup | $108,272 |
| 42 | Ellensburg | $107,866 |
| 43 | Maple Valley | $107,570 |
| 44 | Walla Walla | $107,333 |
| 45 | Camas | $107,298 |
| 46 | Oak Harbor | $106,845 |
| 47 | Kenmore | $106,157 |
| 48 | Covington | $106,148 |
| 49 | Mountlake Terrace | $104,677 |
| 50 | Tukwila | $104,516 |
More Washington Salary Data
Hourly Rates
Explore diagnostic medical sonographer hourly pay in Washington cities.
Senior / Experienced
Top earner salaries for experienced diagnostic medical sonographers.
Compare Cities in Washington
View all comparisons →Explore More Diagnostic Medical Sonographer Salary Data
Frequently Asked Questions
How much do diagnostic medical sonographers make in Washington in 2026?
What is the highest paying city for diagnostic medical sonographers in Washington?
How does Washington diagnostic medical sonographer pay compare to the national average?
What is the entry-level diagnostic medical sonographer salary in Washington?
How many diagnostic medical sonographers are employed in Washington?
Which Washington city offers the best value for diagnostic medical sonographers?
Written by Aisha Khan, RDMS, RVT
Career Analyst
Aisha has over 10 years of experience in abdominal sonography. She works at a regional hospital. Aisha also conducts training for new sonographers.
Methodology & Data Source
Statewide salary figures on this page are 2026 projections based on the Bureau of Labor Statistics Occupational Employment and Wage Statistics (OEWS) survey, May 2026 release. A 4.93% compound annual growth rate (CAGR), derived from 6-year national BLS wage trends, was applied to each metro area's reported salary to estimate current 2026 diagnostic medical sonographer compensation across Washington. State averages are employment-weighted across 50 metro areas — larger metro areas with more diagnostic medical sonographerscontribute proportionally more to the average, producing figures that better reflect typical compensation. Individual pay varies by city, employer, certifications, and experience.
Data Sources & Methodology
Source: BLS, OEWS, 7-year dataset (–). Per-city data from annual BLS metropolitan area surveys.
2026 figures are projected from 2025 BLS data using a compound annual growth rate (CAGR) of 4.93%, derived from historical BLS wage trends for diagnostic medical sonographers (SOC 29-2032).
Compiled and verified by Aisha Khan, RDMS, RVT, a licensed diagnostic medical sonographer with 10+ years of clinical experience. · View source data at BLS.gov