Diagnostic Medical Sonographer Salary in Illinois: $105,432 (2026)
Quick Answer:Across Illinois's 64 metropolitan areas, the average median diagnostic medical sonographer pay sits at $105,432/year heading into 2026 — a figure projected from 2025 BLS OEWS wage data for SOC 29-2032. Because Illinois sits at BEA RPP 97.1 (3% below the U.S. baseline), that statewide median translates to roughly $108,581 in nationally-comparable purchasing power. Highest-paying metros: Naperville ($104,156), Chicago ($103,080), Elgin ($102,161).
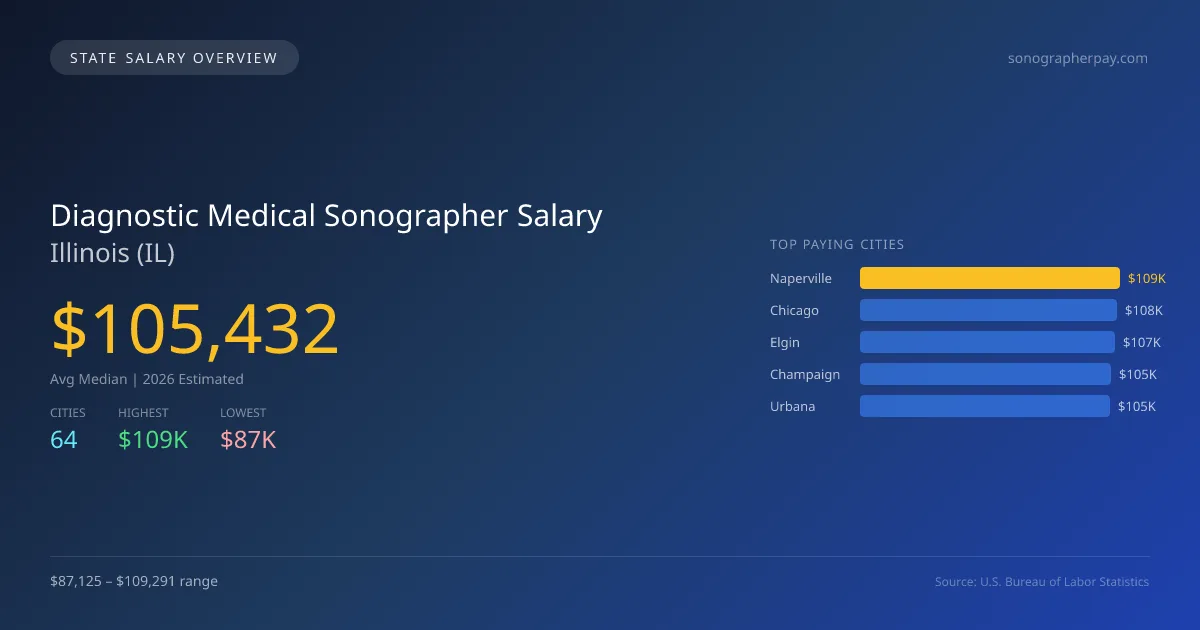
In Illinois, the average median salary for diagnostic medical sonographers is projected to reach $105,433 in 2026, which is slightly above the national median of $101,352, marking a 4.0% increase. The salary range across different cities in the state shows significant variability, with Naperville leading at $109,291, while Rock Island offers the lowest at $87,125. This $22,166 difference can be attributed to factors like the cost of living, demand for healthcare services, and local market conditions. Illinois requires specific state licensing for sonographers, which ensures a standardized level of skill and professionalism in the workforce. The scope of practice laws in Illinois enable sonographers to perform a range of diagnostic procedures, contributing to robust demand for their services, particularly in large metro areas. With an annual compound growth rate of 4.93% projected for the profession, the job market indicates healthy growth opportunities through to 2026. Top cities like Chicago at $108,162, Elgin at $107,198, Champaign at $105,371, and Urbana at $104,987 offer favorable employment settings, reflecting the ongoing advancements and expansions in healthcare facilities throughout the state.
Illinois Diagnostic Medical Sonographer Salary Range
Overall salary range in Illinois: $60,083 (lowest entry-level) to $154,330 (highest top earner)
Illinois vs National Average
Illinois diagnostic medical sonographers earn 4.03% more than the national median (+$4,080/year difference).
Illinois Diagnostic Medical Sonographer Salary Distribution (2026)
Diagnostic Medical Sonographer salaries in Illinois range from $83,065 (entry-level, 10th percentile) to $128,580 (top earners, 90th percentile), with a median of $105,432. The Illinois median is $4,080 above the US national median of $101,352. The average hourly rate is $50.69/hr. Approximately 3,454 diagnostic medical sonographers are employed across 64 cities.
2019 BLS Actual
$78,157
2025 BLS Actual
$100,479
2026 Current Est.
$105,432
2019–2027 Growth
+41.5%
Salary Trajectory for Diagnostic Medical Sonographers in Illinois (2019–2027)
2019–2025: actual BLS OEWS data for this metro area. 2026+: CAGR 4.93% projection.
| Year | Annual Salary | Status |
|---|---|---|
| 2019 | $78,157 | Actual |
| 2020 | $80,025 | Actual |
| 2021 | $79,174 | Actual |
| 2022 | $84,874 | Actual |
| 2023 | $95,550 | Actual |
| 2024 | $96,086 | Actual |
| 2025 | $100,479 | Actual |
| 2026(current) | $105,432 | Estimated |
| 2027 | $110,630 | Projected |
Based on 7 years of BLS OEWS data for the Illinois metropolitan area, the median diagnostic medical sonographer salary grew 28.6% from $78,157 (2019) to $100,479 (2025). At a 4.93% compound annual growth rate, salaries are projected to reach $110,630 by 2027 — a total increase of $32,473 (41.55%) from 2019.
Note: Historical values (2019–2025) are actual BLS OEWS figures for the Illinois metropolitan area, sourced from annual Occupational Employment and Wage Statistics surveys. 2026–2026 figures are current estimates, and 2027 values are projections, calculated using a 4.93% CAGR derived from 7-year BLS historical data. Actual salaries may vary based on employer, experience, certifications, and local market conditions.
Top 5 Highest Paying Cities in Illinois
Lowest Paying Cities in Illinois
| City | Median Salary |
|---|---|
| Rock Island | $87,125 |
| Moline | $88,496 |
| Carbondale | $95,084 |
| Elmhurst | $96,031 |
| Calumet City | $96,267 |
Best Value Cities for Diagnostic Medical Sonographers in Illinois
When adjusted for local cost of living, these Illinois cities offer the most purchasing power for diagnostic medical sonographers.
| City | Nominal Salary | CoL Index | Adjusted Salary |
|---|---|---|---|
| Champaign | $105,371 | 92.704 | $113,664 |
| Naperville | $109,291 | 97.1 | $112,555 |
| Springfield | $103,325 | 92.745 | $111,408 |
| Elgin | $107,198 | 97.1 | $110,400 |
| Rockford | $99,704 | 92.154 | $108,193 |
Adjusted salary = nominal salary × (100 / CoL index). CoL index: 100 = national average. Lower index = lower cost of living.
Salary by Experience Level in Illinois
| Experience Level | Estimated Annual |
|---|---|
| Entry Level (0-2 years) | $83,065 |
| Mid Career (3-7 years) | $105,432 |
| Experienced (7+ years) | $128,580 |
Estimates based on BLS percentile data averaged across Illinois metro areas. Individual pay varies by employer, certifications, and specialization.
All 64 Cities in Illinois
| # | City | Median Salary |
|---|---|---|
| 1 | Naperville | $109,291 |
| 2 | Chicago | $108,162 |
| 3 | Elgin | $107,198 |
| 4 | Champaign | $105,371 |
| 5 | Urbana | $104,987 |
| 6 | Springfield | $103,325 |
| 7 | Decatur | $102,931 |
| 8 | Orland Park | $102,931 |
| 9 | Bolingbrook | $102,489 |
| 10 | Palatine | $101,717 |
| 11 | Waukegan | $101,661 |
| 12 | Mount Prospect | $101,468 |
| 13 | Hoffman Estates | $101,139 |
| 14 | Evanston | $100,946 |
| 15 | Joliet | $100,861 |
| 16 | Oak Park | $100,777 |
| 17 | Danville | $100,568 |
| 18 | Addison | $100,356 |
| 19 | Berwyn | $100,310 |
| 20 | Aurora | $100,245 |
| 21 | Tinley Park | $100,230 |
| 22 | Northbrook | $100,127 |
| 23 | St. Charles | $100,064 |
| 24 | Gurnee | $100,040 |
| 25 | Arlington Heights | $99,901 |
| 26 | Wheaton | $99,772 |
| 27 | Woodridge | $99,741 |
| 28 | Rockford | $99,704 |
| 29 | Schaumburg | $99,691 |
| 30 | Buffalo Grove | $99,663 |
| 31 | Bartlett | $99,655 |
| 32 | Lake in the Hills | $99,285 |
| 33 | Collinsville | $99,269 |
| 34 | Skokie | $99,241 |
| 35 | Wheeling | $99,095 |
| 36 | Carpentersville | $98,985 |
| 37 | Oak Lawn | $98,920 |
| 38 | O'Fallon | $98,899 |
| 39 | Quincy | $98,512 |
| 40 | Algonquin | $98,512 |
| 41 | Bloomington | $98,487 |
| 42 | Carol Stream | $98,425 |
| 43 | Normal | $98,421 |
| 44 | Lombard | $98,362 |
| 45 | Cicero | $98,261 |
| 46 | Plainfield | $98,158 |
| 47 | Des Plaines | $98,140 |
| 48 | Oswego | $97,764 |
| 49 | DeKalb | $97,686 |
| 50 | Park Ridge | $97,607 |
| 51 | Hanover Park | $97,567 |
| 52 | Glenview | $97,560 |
| 53 | Romeoville | $97,165 |
| 54 | Streamwood | $97,032 |
| 55 | Downers Grove | $96,850 |
| 56 | Belleville | $96,826 |
| 57 | Crystal Lake | $96,669 |
| 58 | Peoria | $96,630 |
| 59 | Galesburg | $96,298 |
| 60 | Calumet City | $96,267 |
| 61 | Elmhurst | $96,031 |
| 62 | Carbondale | $95,084 |
| 63 | Moline | $88,496 |
| 64 | Rock Island | $87,125 |
More Illinois Salary Data
Hourly Rates
Explore diagnostic medical sonographer hourly pay in Illinois cities.
Senior / Experienced
Top earner salaries for experienced diagnostic medical sonographers.
Compare Cities in Illinois
View all comparisons →Explore More Diagnostic Medical Sonographer Salary Data
Frequently Asked Questions
How much do diagnostic medical sonographers make in Illinois in 2026?
What is the highest paying city for diagnostic medical sonographers in Illinois?
How does Illinois diagnostic medical sonographer pay compare to the national average?
What is the entry-level diagnostic medical sonographer salary in Illinois?
How many diagnostic medical sonographers are employed in Illinois?
Which Illinois city offers the best value for diagnostic medical sonographers?
Written by Aisha Khan, RDMS, RVT
Career Analyst
Aisha has over 10 years of experience in abdominal sonography. She works at a regional hospital. Aisha also conducts training for new sonographers.
Methodology & Data Source
Statewide salary figures on this page are 2026 projections based on the Bureau of Labor Statistics Occupational Employment and Wage Statistics (OEWS) survey, May 2026 release. A 4.93% compound annual growth rate (CAGR), derived from 6-year national BLS wage trends, was applied to each metro area's reported salary to estimate current 2026 diagnostic medical sonographer compensation across Illinois. State averages are employment-weighted across 64 metro areas — larger metro areas with more diagnostic medical sonographerscontribute proportionally more to the average, producing figures that better reflect typical compensation. Individual pay varies by city, employer, certifications, and experience.
Data Sources & Methodology
Source: BLS, OEWS, 7-year dataset (–). Per-city data from annual BLS metropolitan area surveys.
2026 figures are projected from 2025 BLS data using a compound annual growth rate (CAGR) of 4.93%, derived from historical BLS wage trends for diagnostic medical sonographers (SOC 29-2032).
Compiled and verified by Aisha Khan, RDMS, RVT, a licensed diagnostic medical sonographer with 10+ years of clinical experience. · View source data at BLS.gov